Interactive and dynamic maps have become a common feature of »DER SPIEGEL« publications. These maps come in various forms, including look-up maps, scrollytellings and maps with regularly updated data.
Until recently, Mapbox was our go-to solution for such maps. It’s a versatile and powerful tool that allows you to conveniently combine vector and raster data to customisable maps. However, this rich set of features comes at a price. So we often found ourselves having to decide whether to use Mapbox or simply stick with static maps created using Datawrapper or ai2html.
This is why I started looking for open-source technology-based alternatives. The result of this endeavour is a tech stack which now enables us to create rich, interactive, data-driven maps for just the cost of hosting on our infrastructure.
- Planetiler, Tilemaker and tippecanoe for data processing and tile generation
- Protomaps for serving tiles without middleware from a single container (PMTiles) file via HTTP range requests
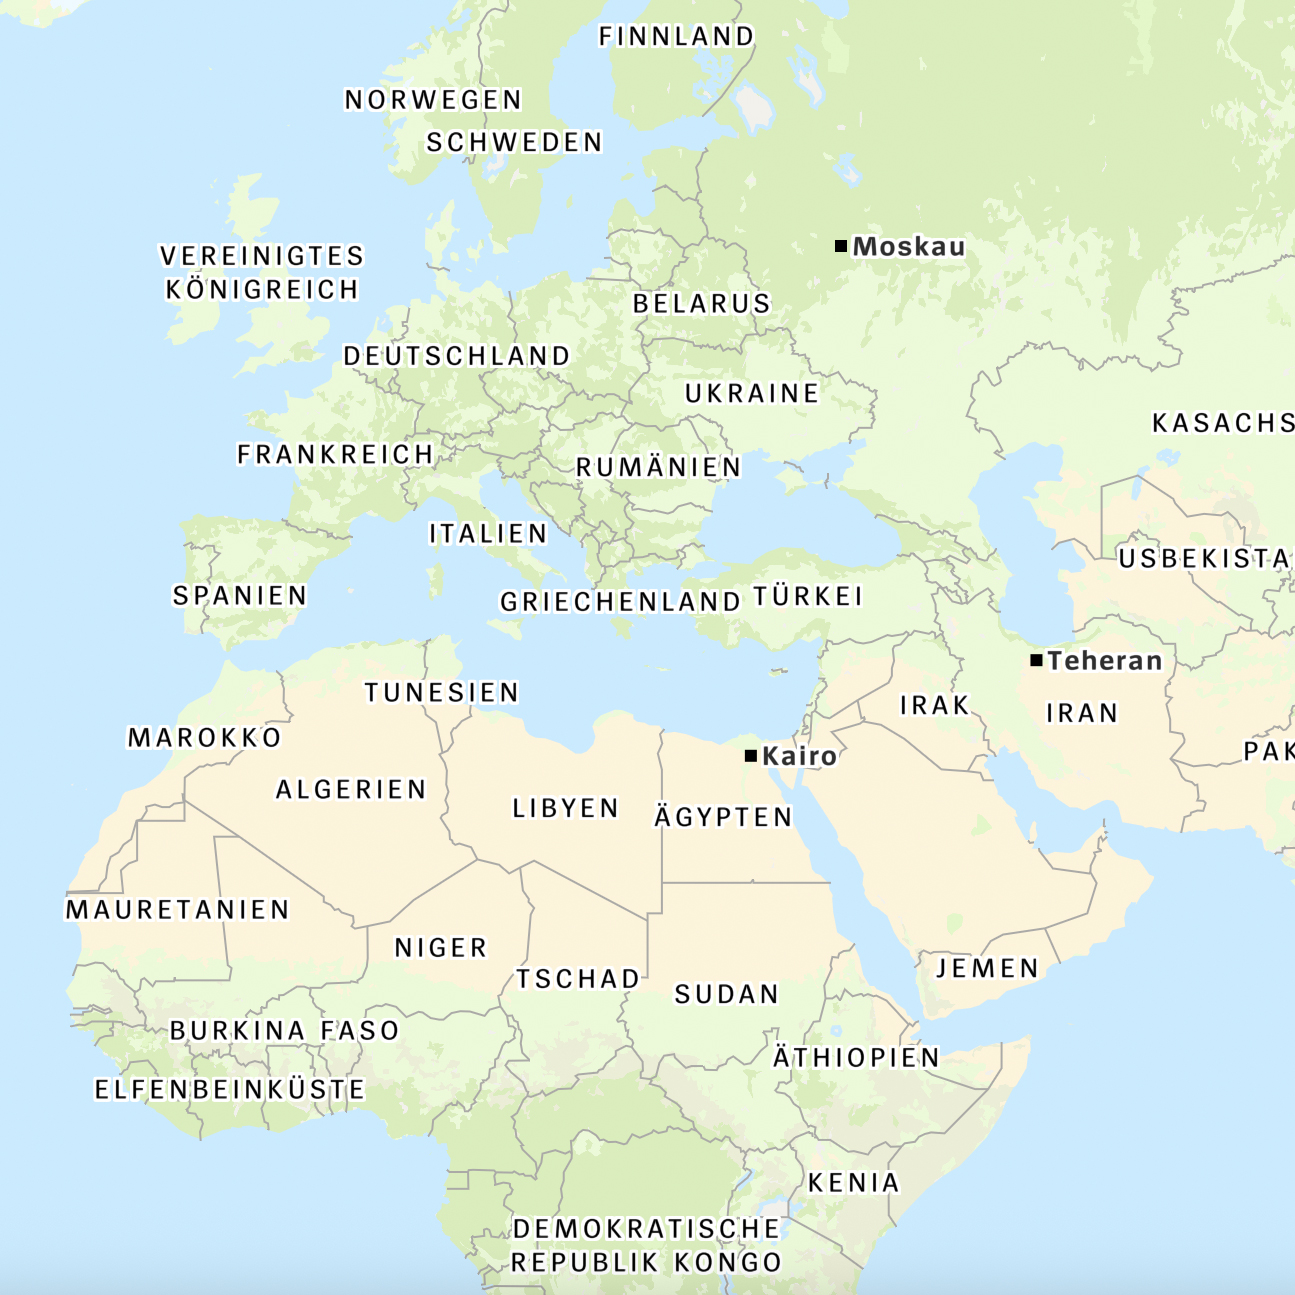
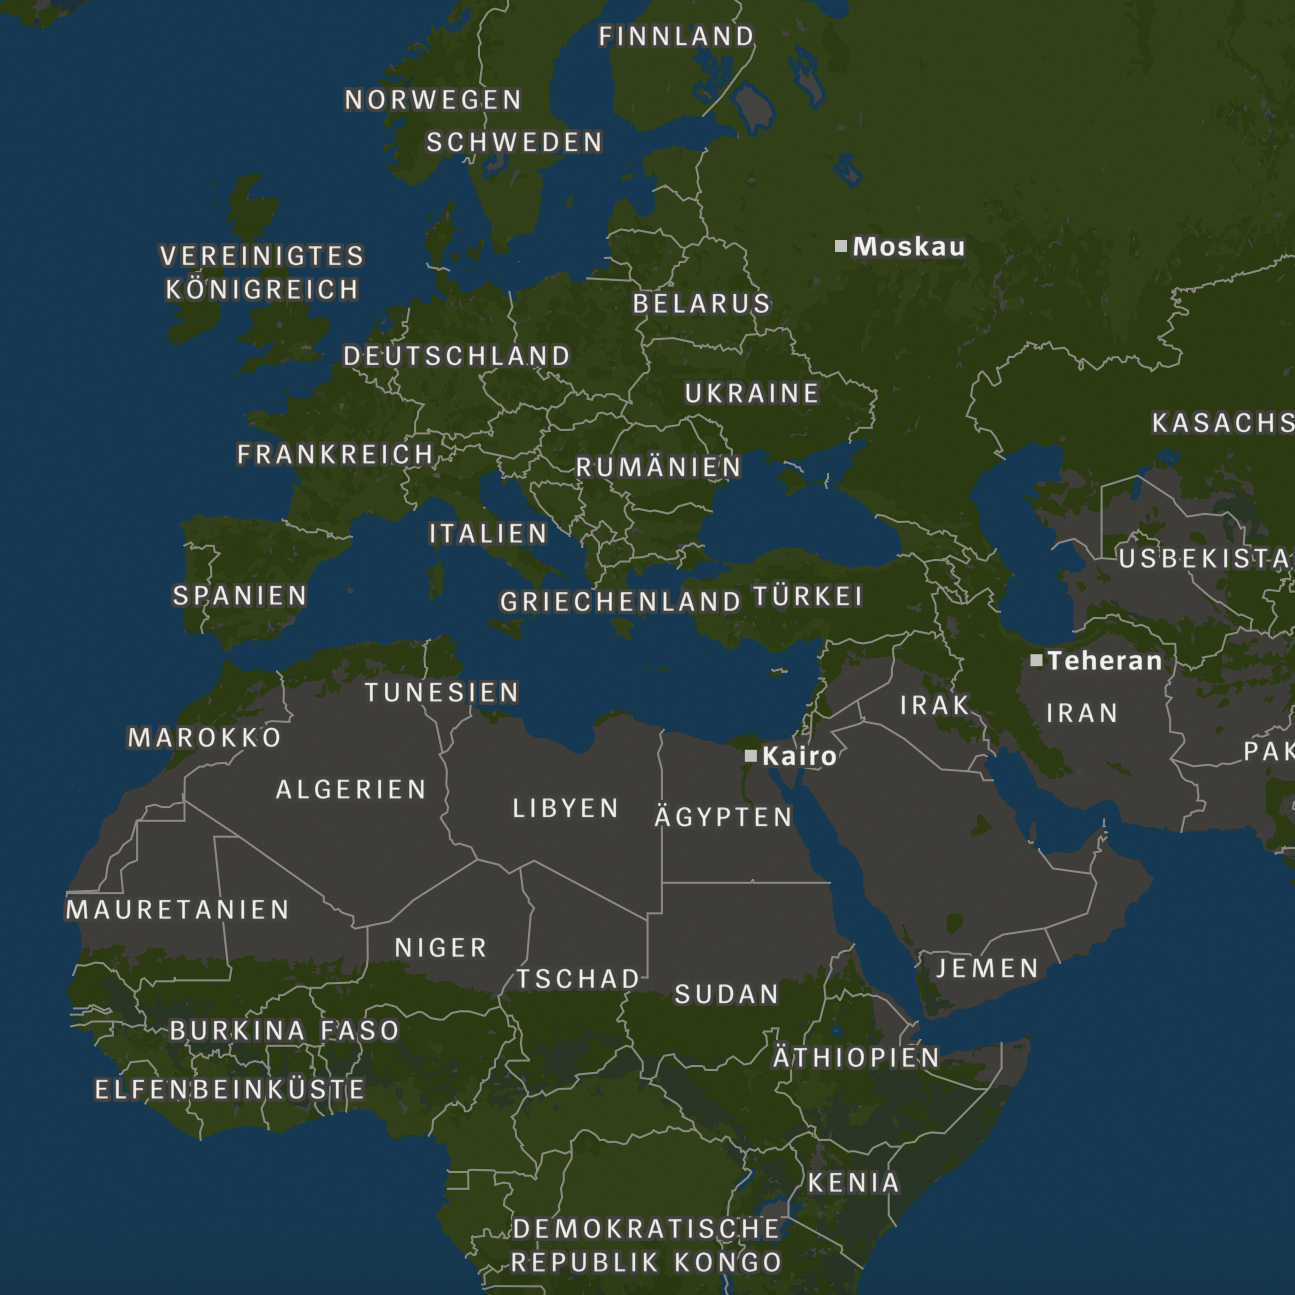
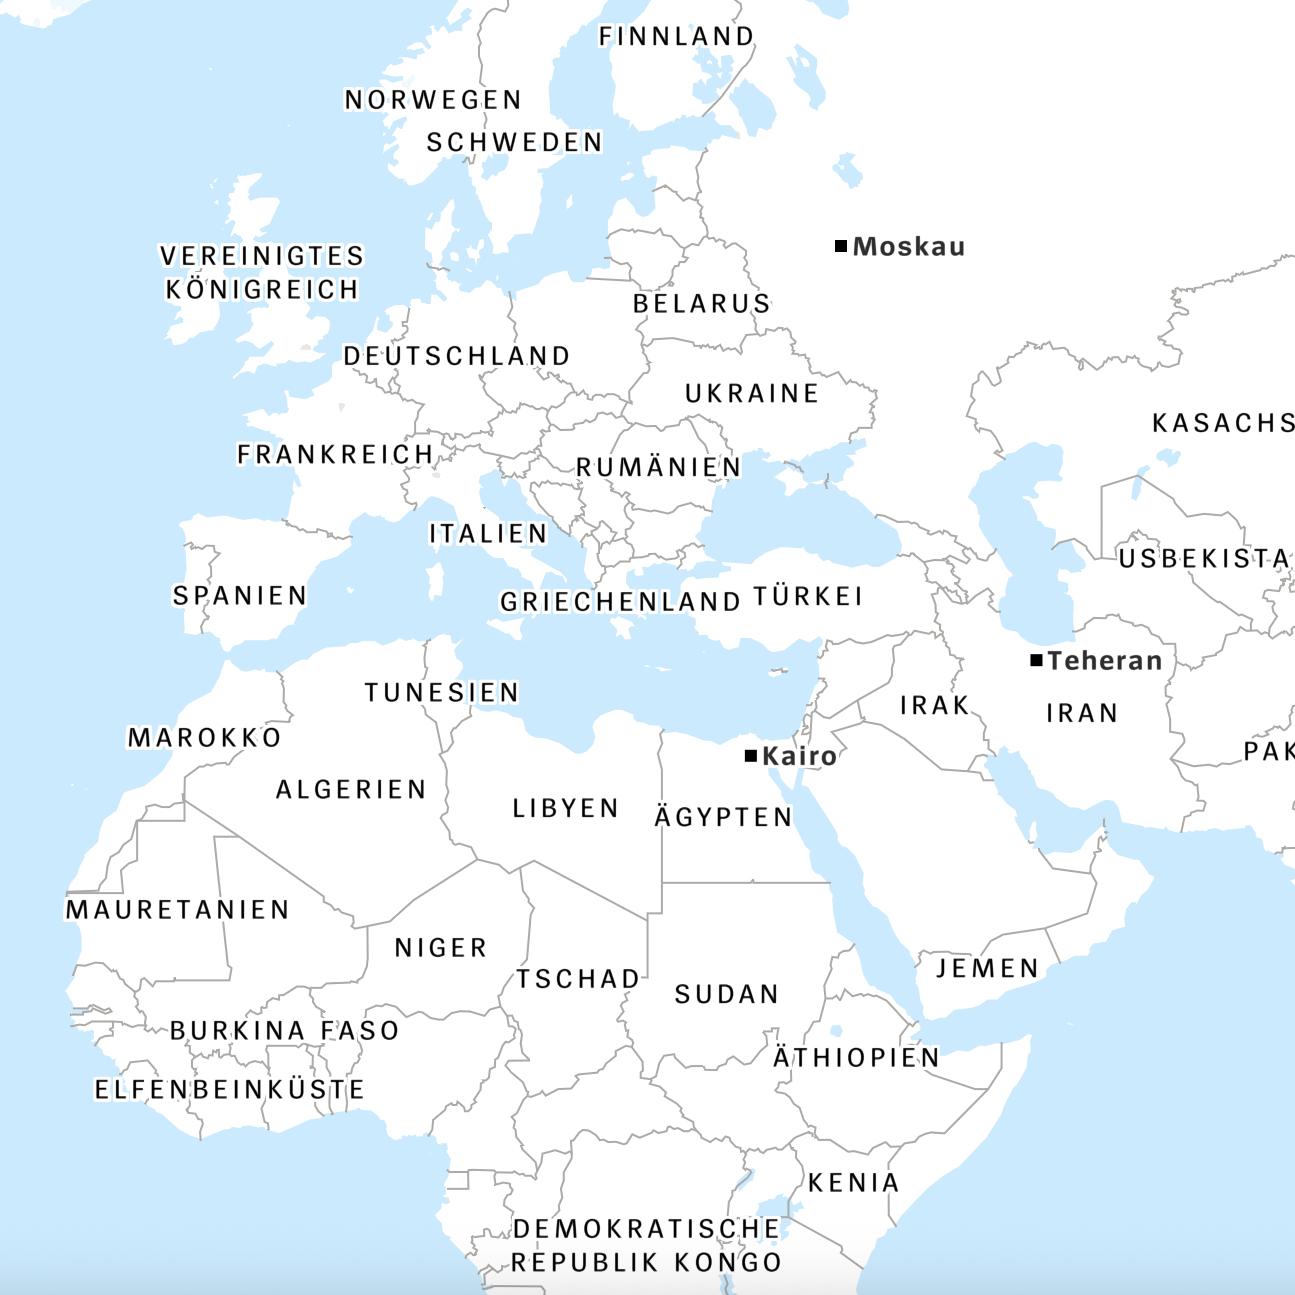
- Maputnik for styling
- MapLibre GL JS for map rendering
Hosting our own maps comes with several benefits:
- It saves us thousands of dollars a year in service provider costs
- It improves the product, because costs are not a restriction for using such maps anymore
- We are in full control of the map data
One potential drawback of hosting map data yourself is that you have to manage data updates. Protomaps doesn’t allow you to perform transactional updates. This means that any update requires the entire PMTiles container to be rebuilt, which uses a lot of CPU resources (or time, or both). However, as we don’t require daily updates to our basemaps, this won’t be an issue for us (You would probably see things differently if you were building a navigation app, though).
Building the proof of concept
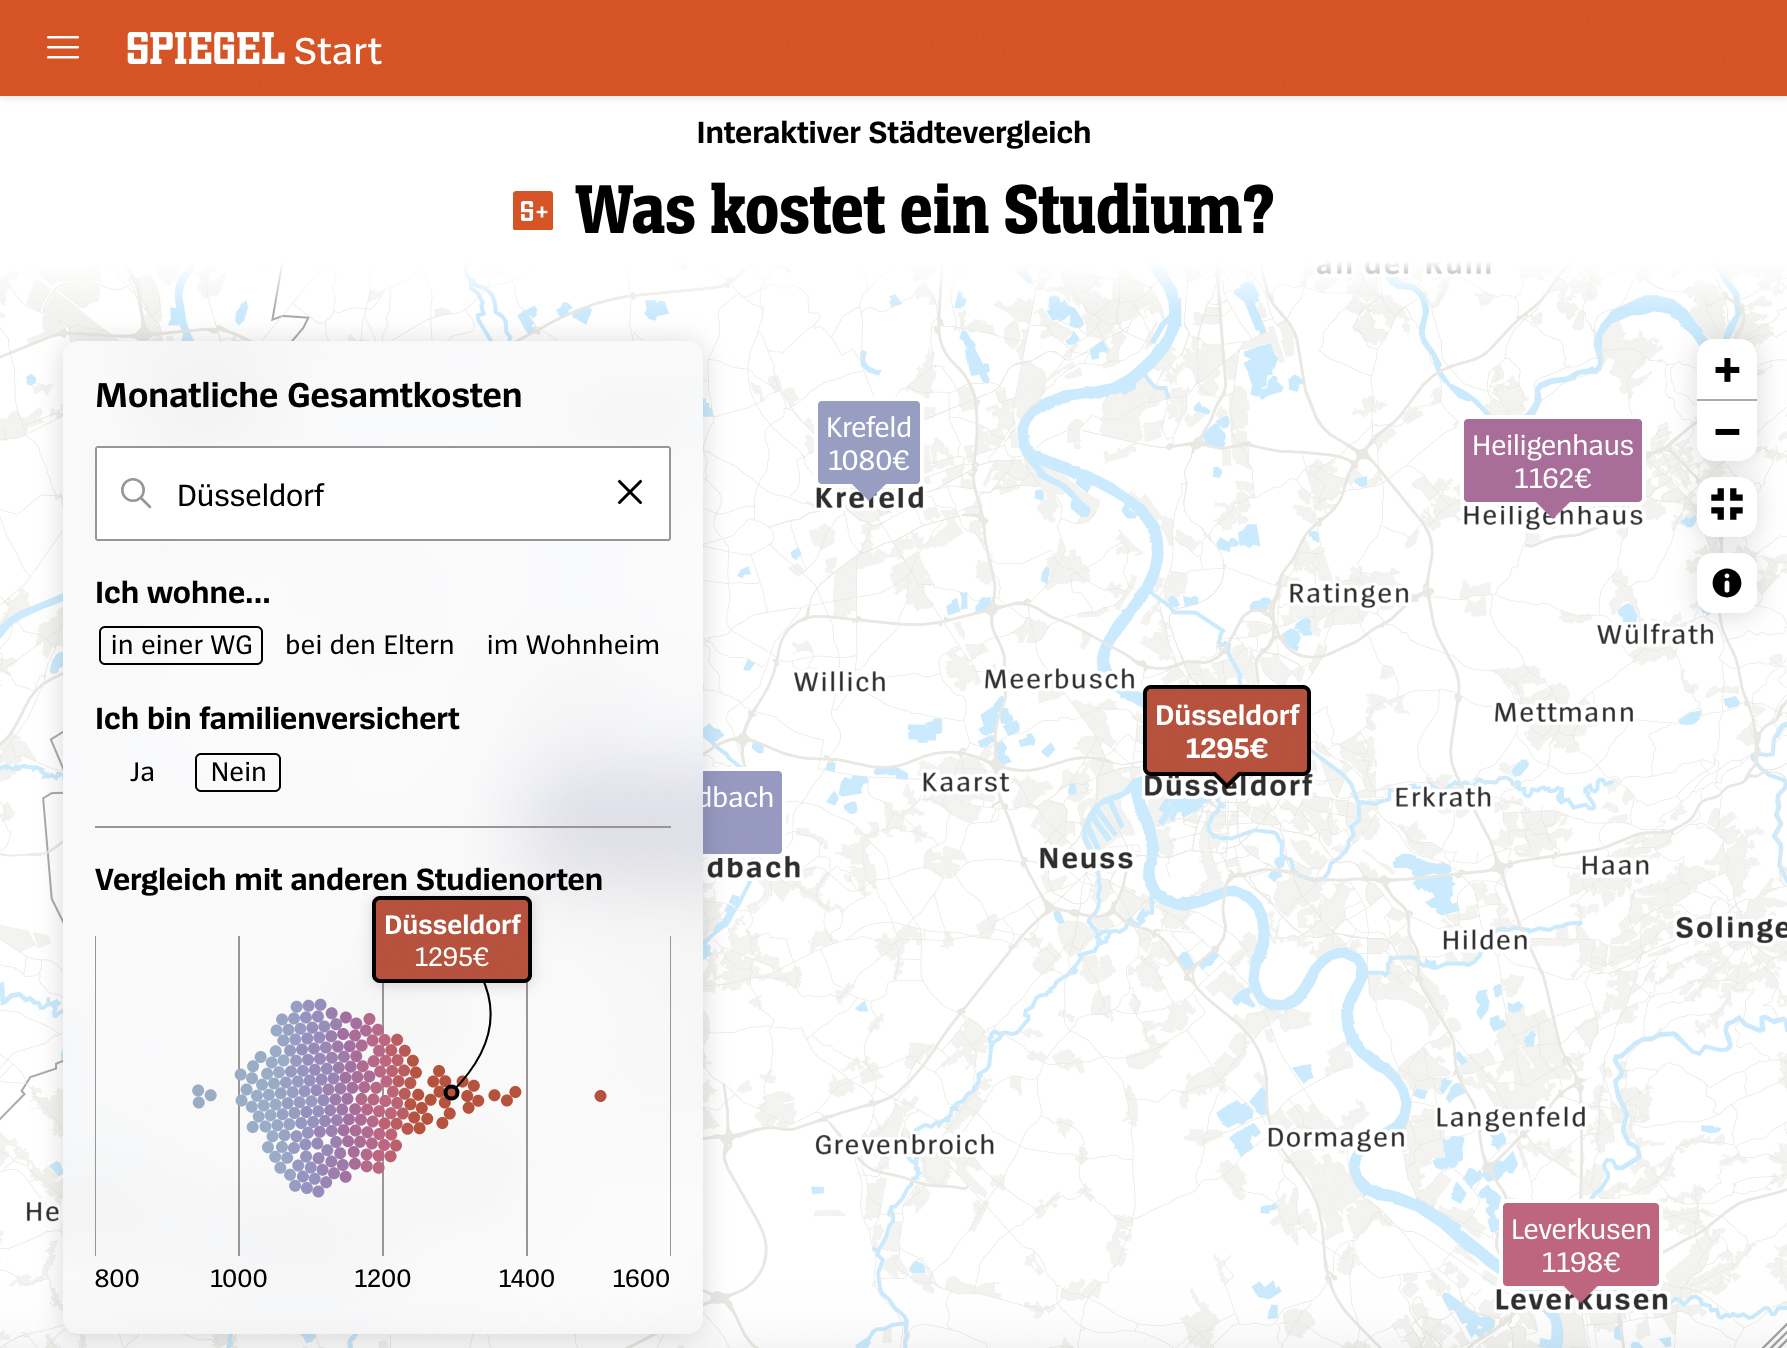
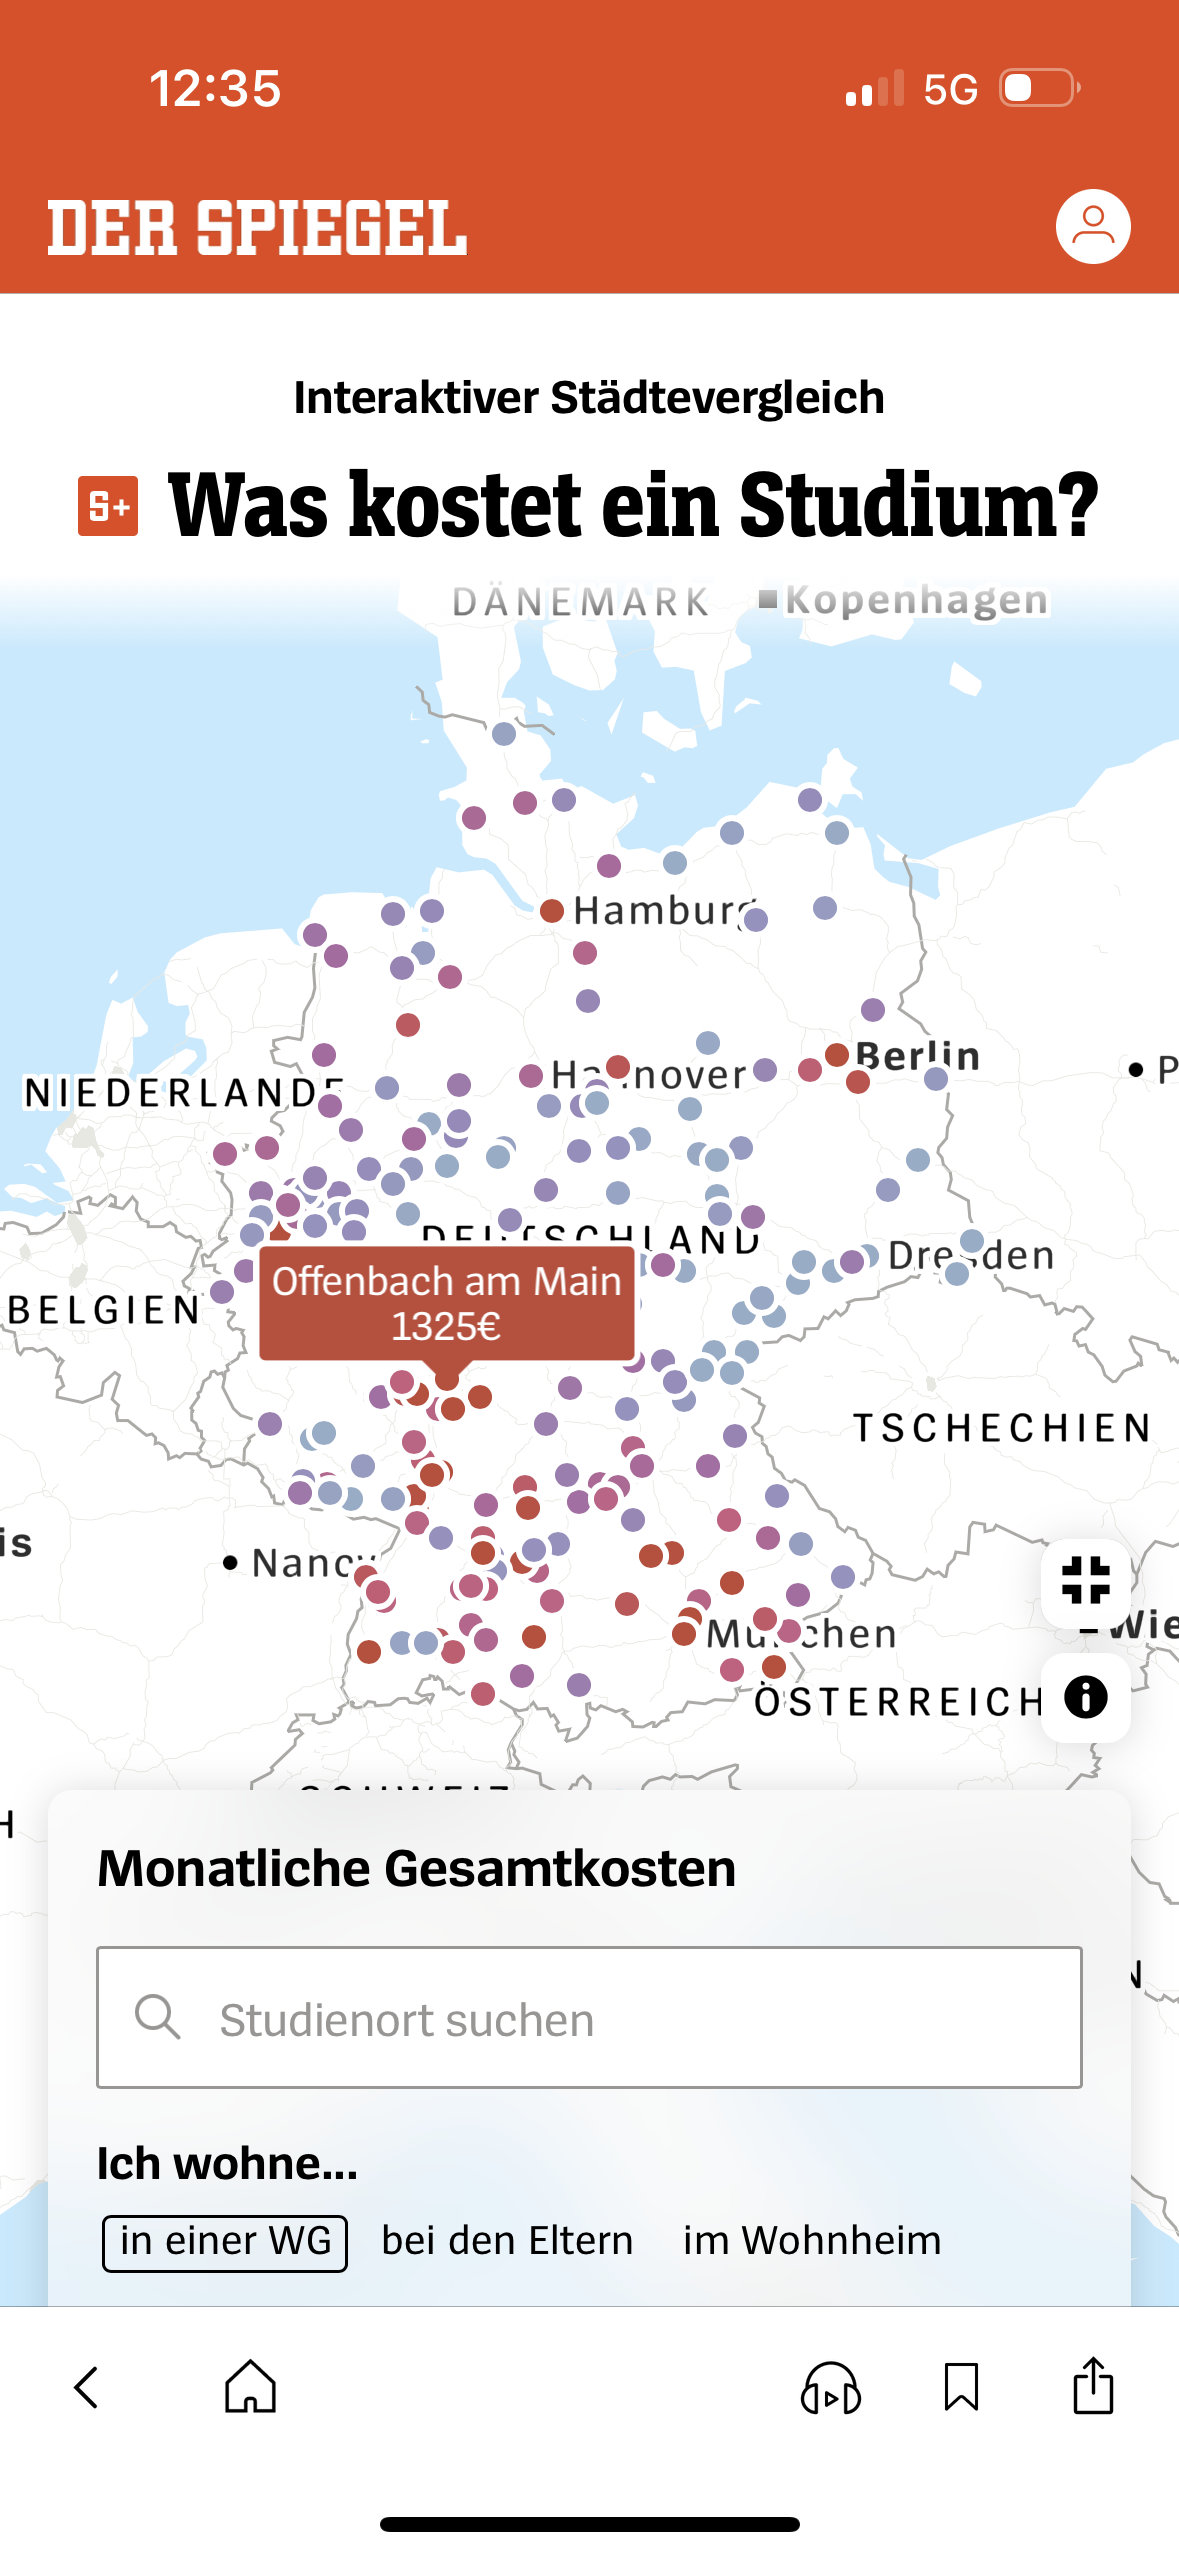
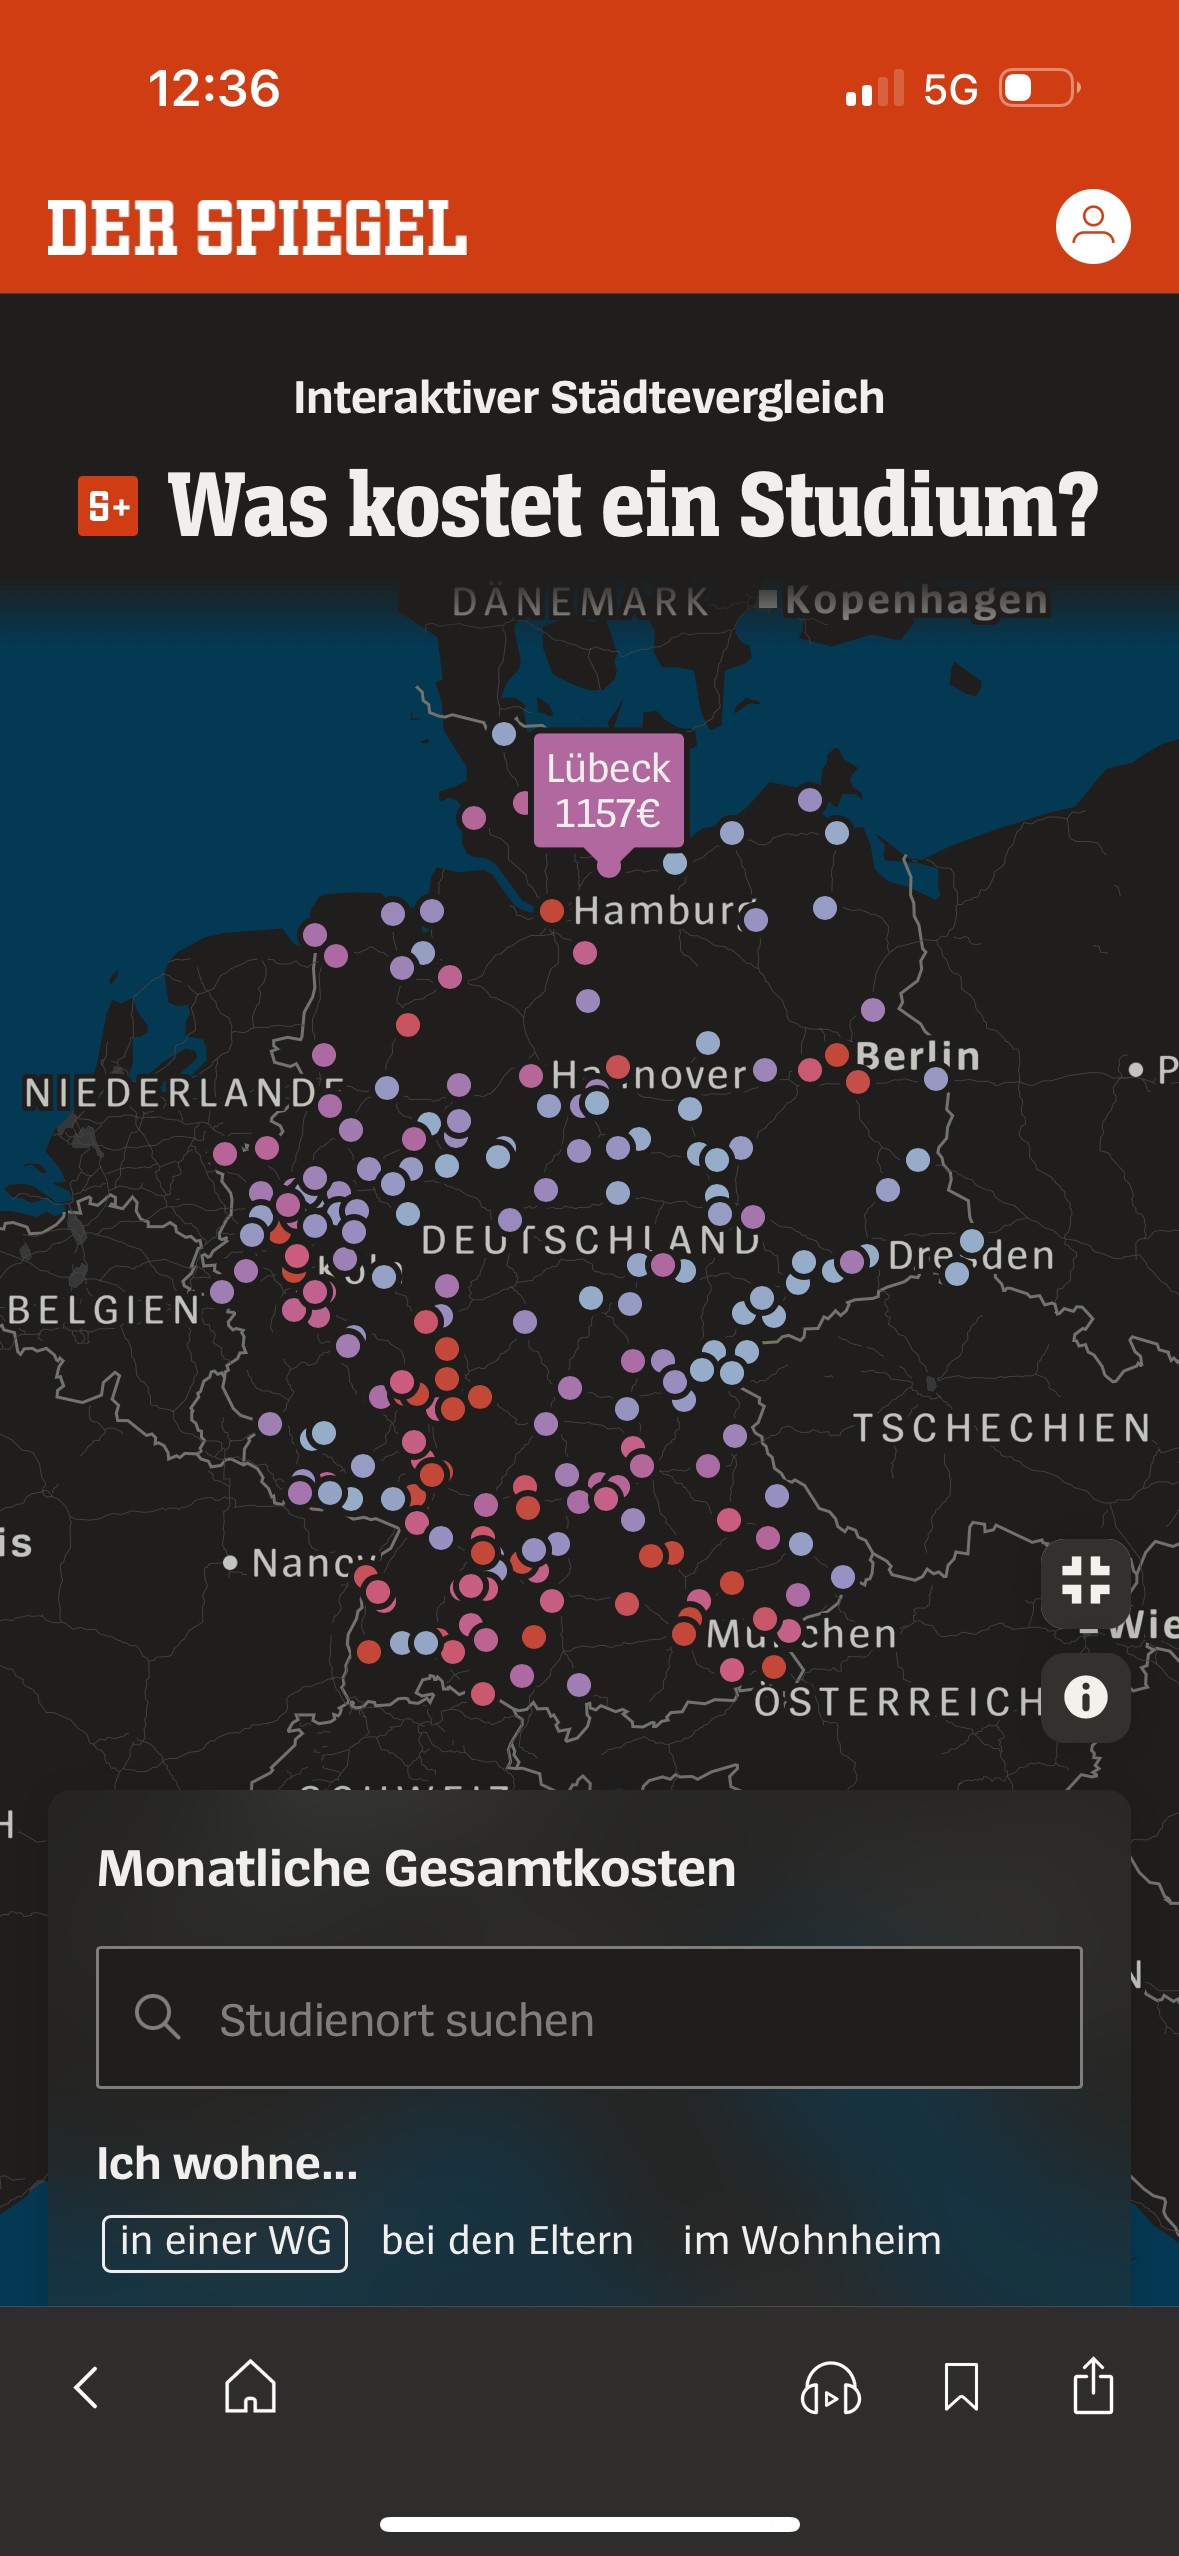
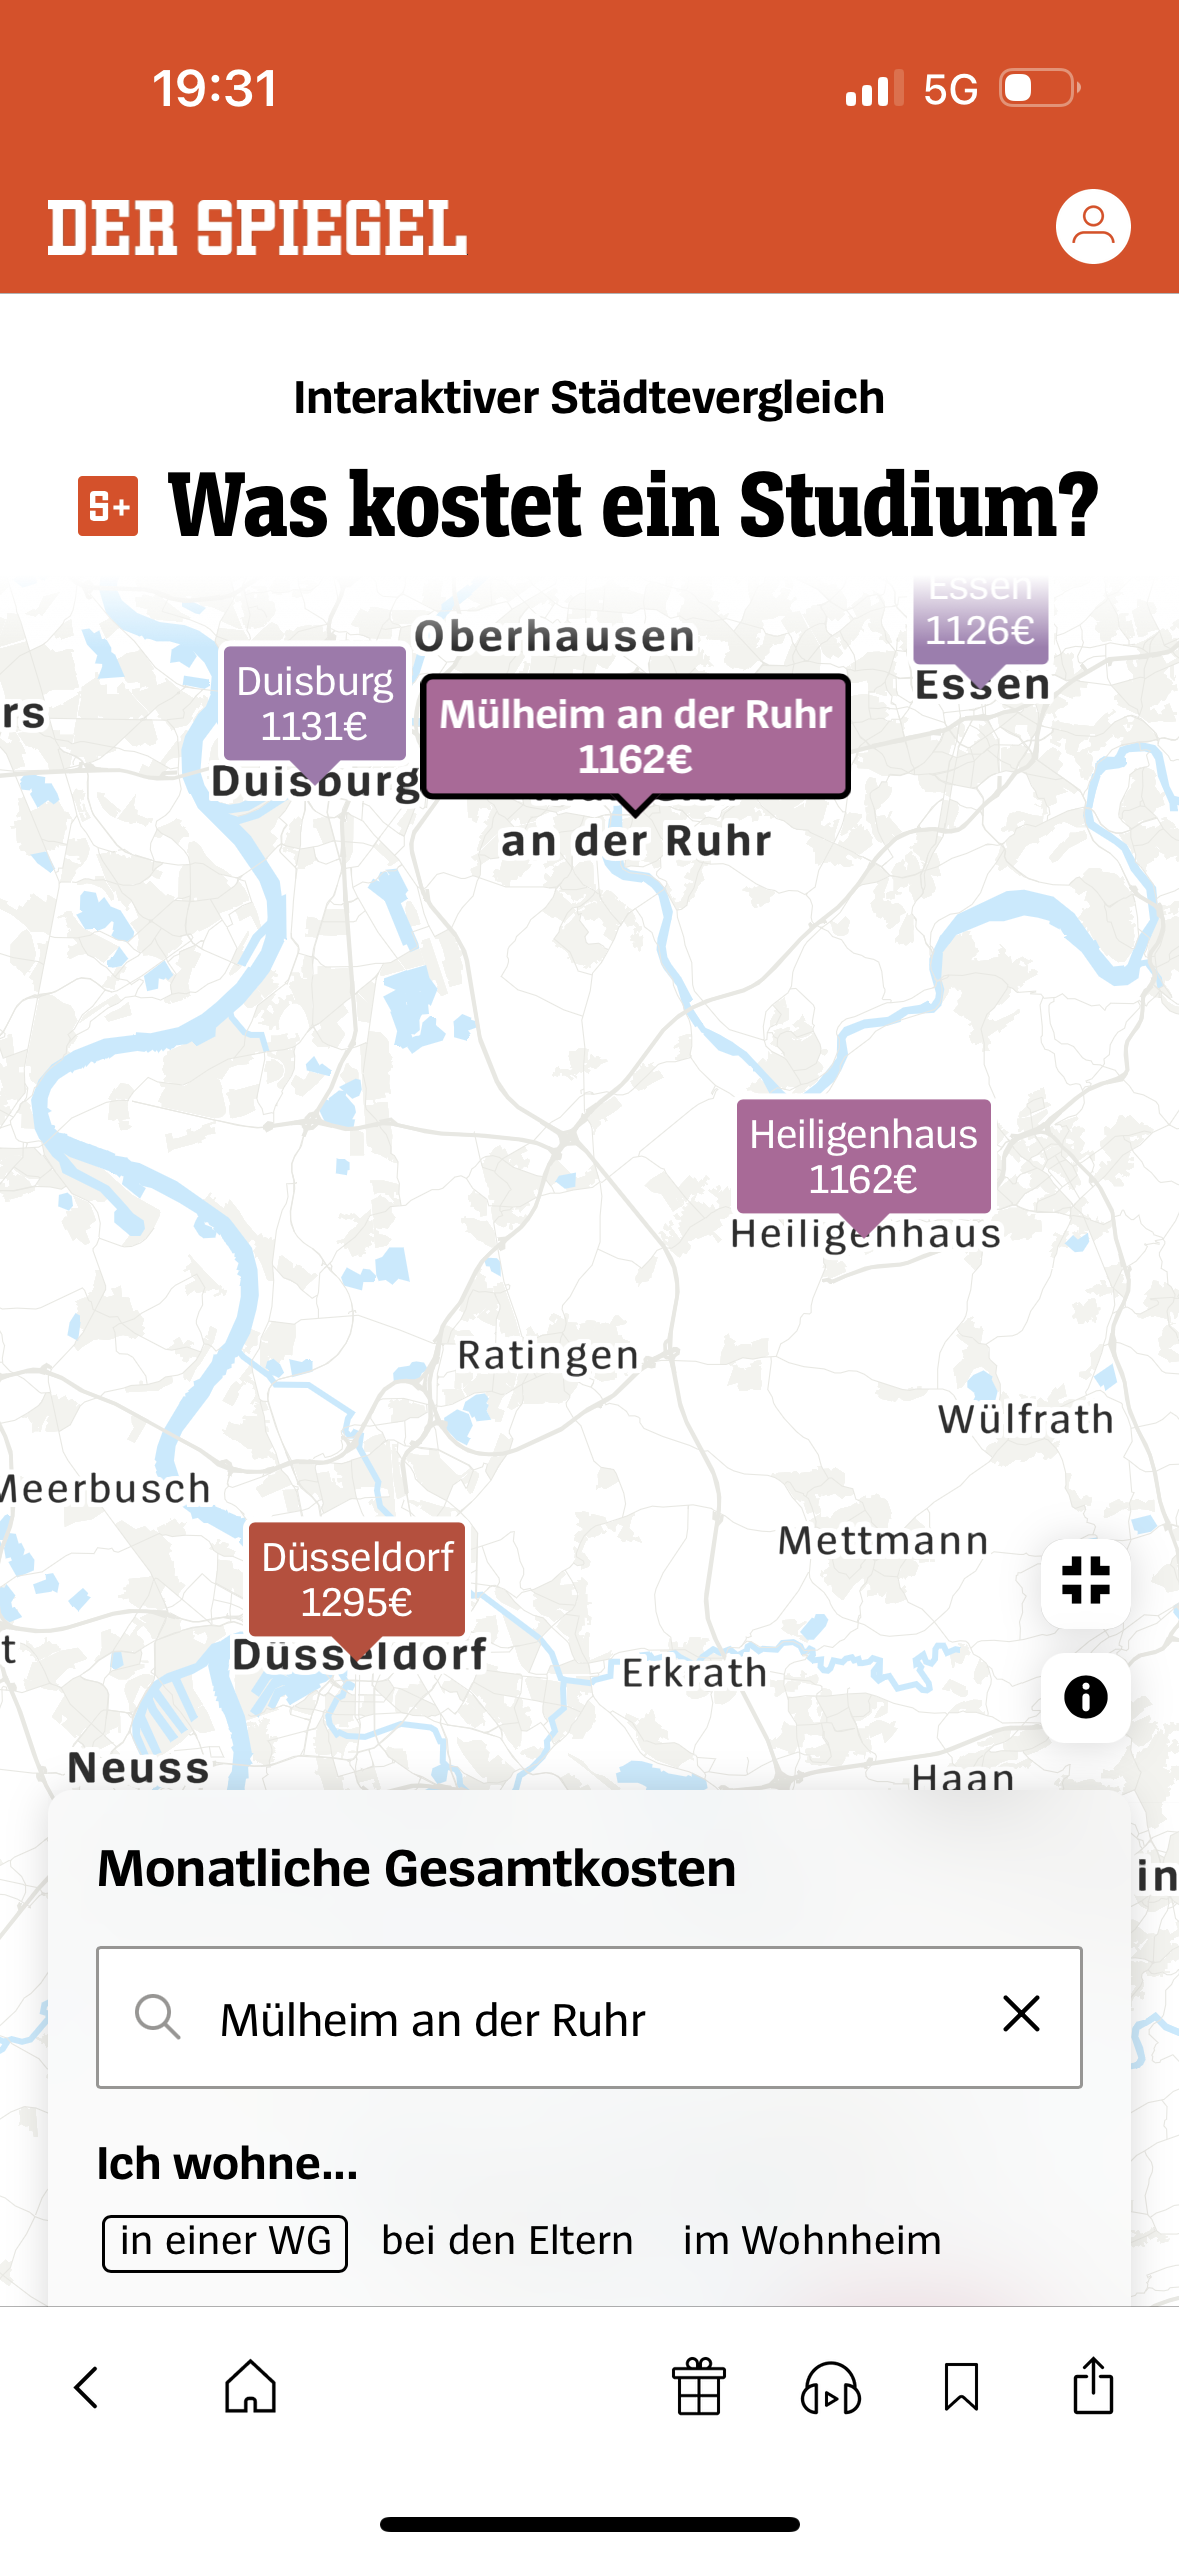
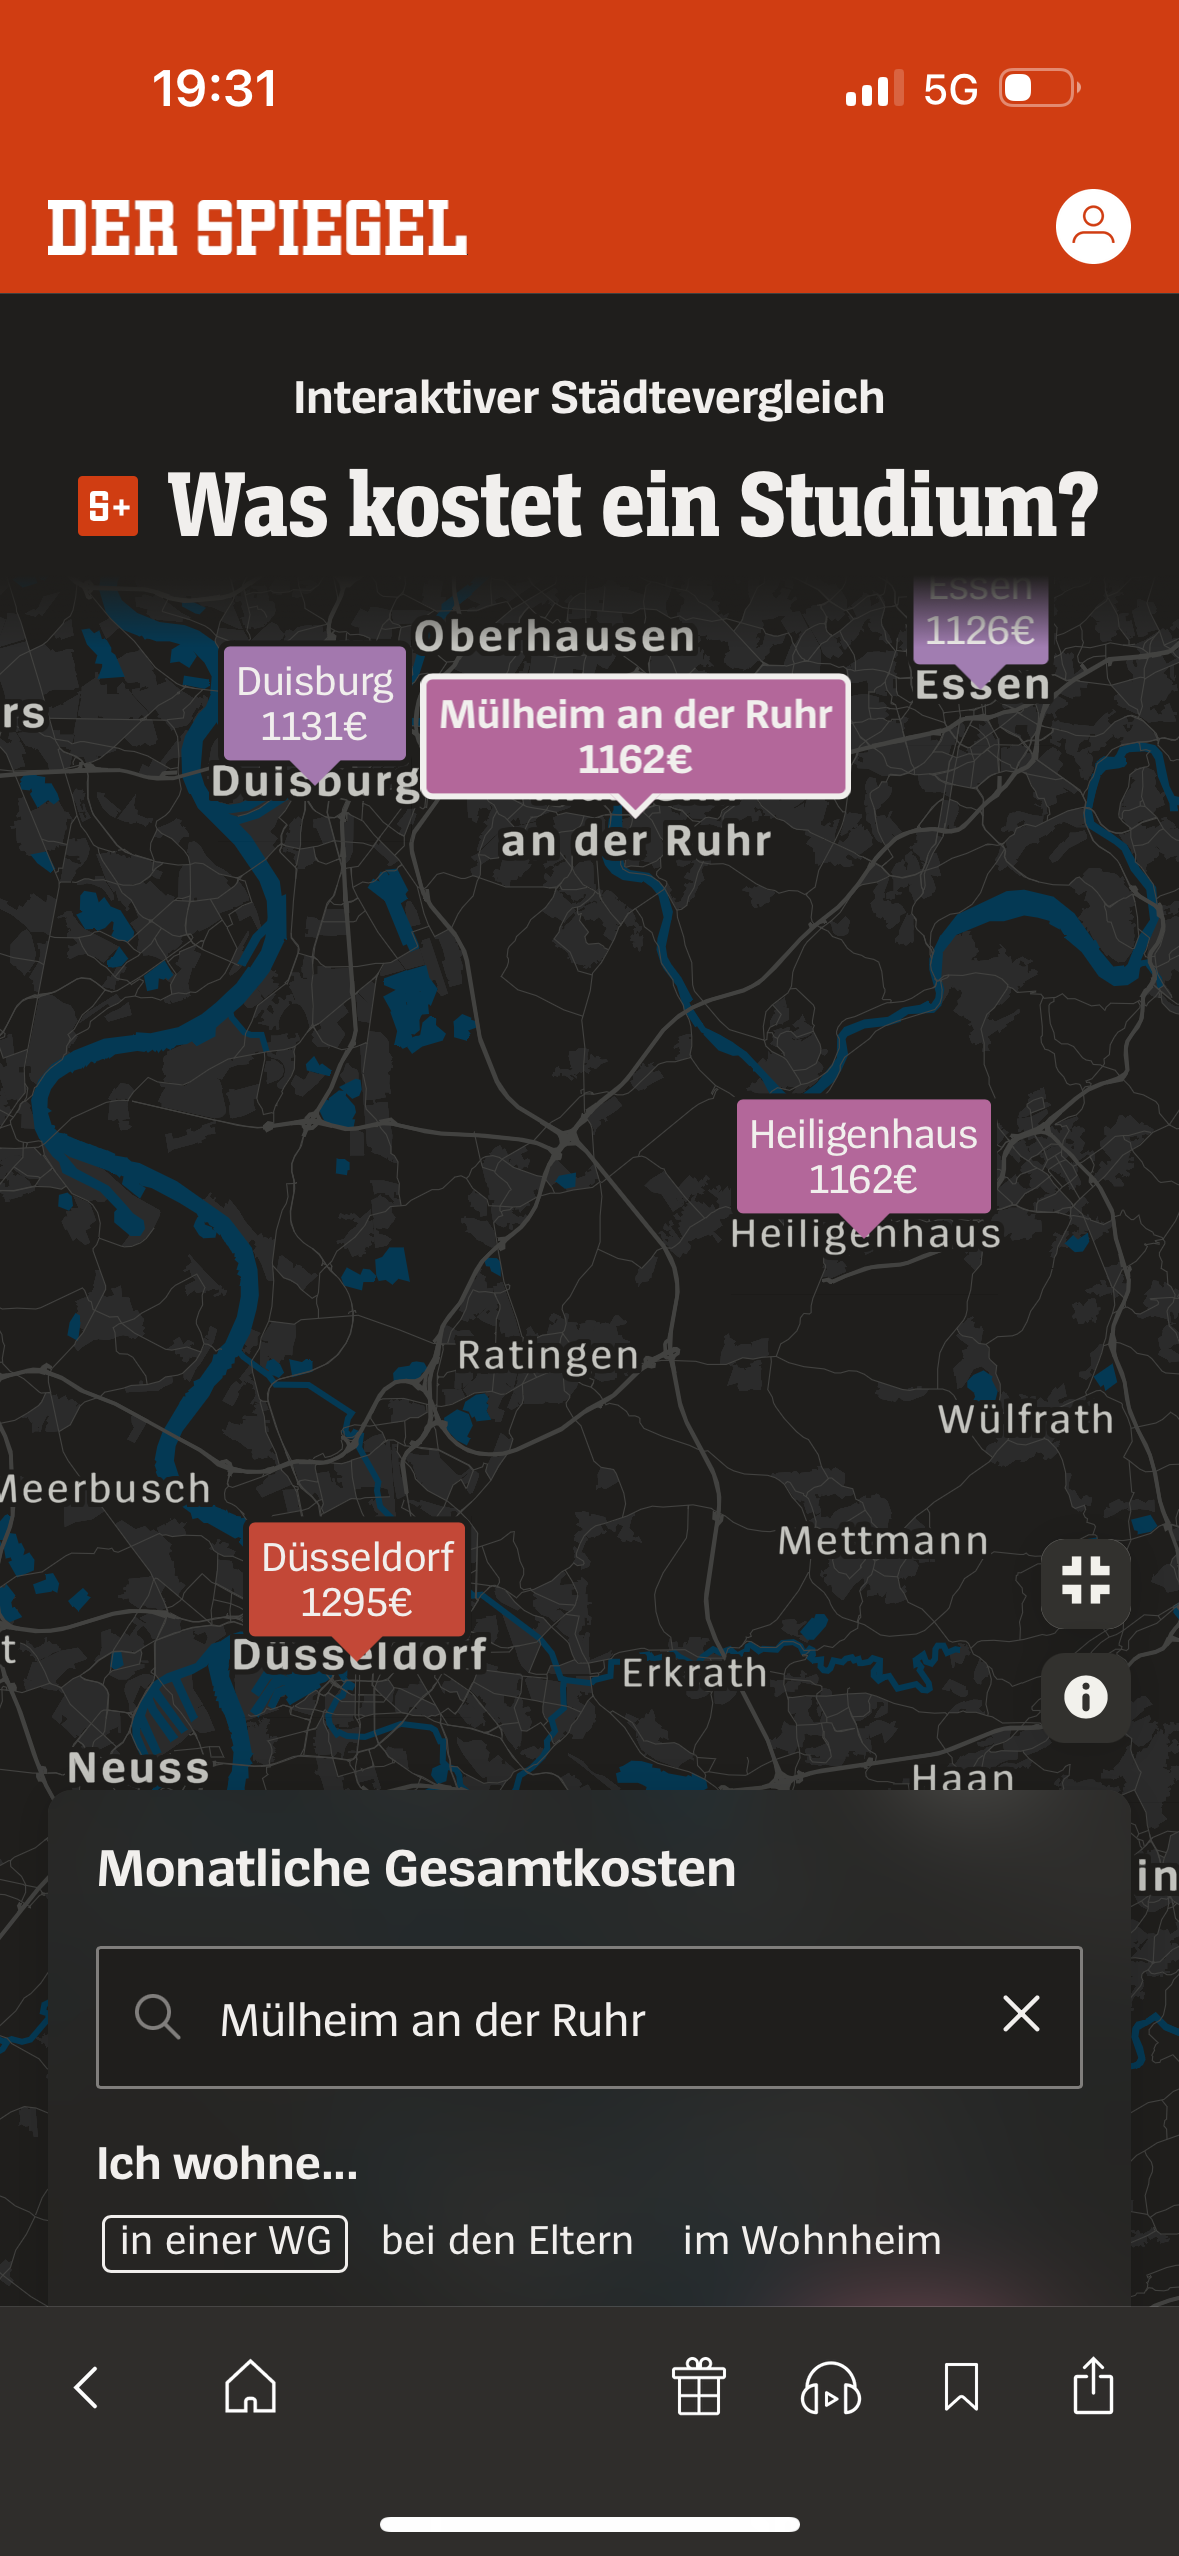
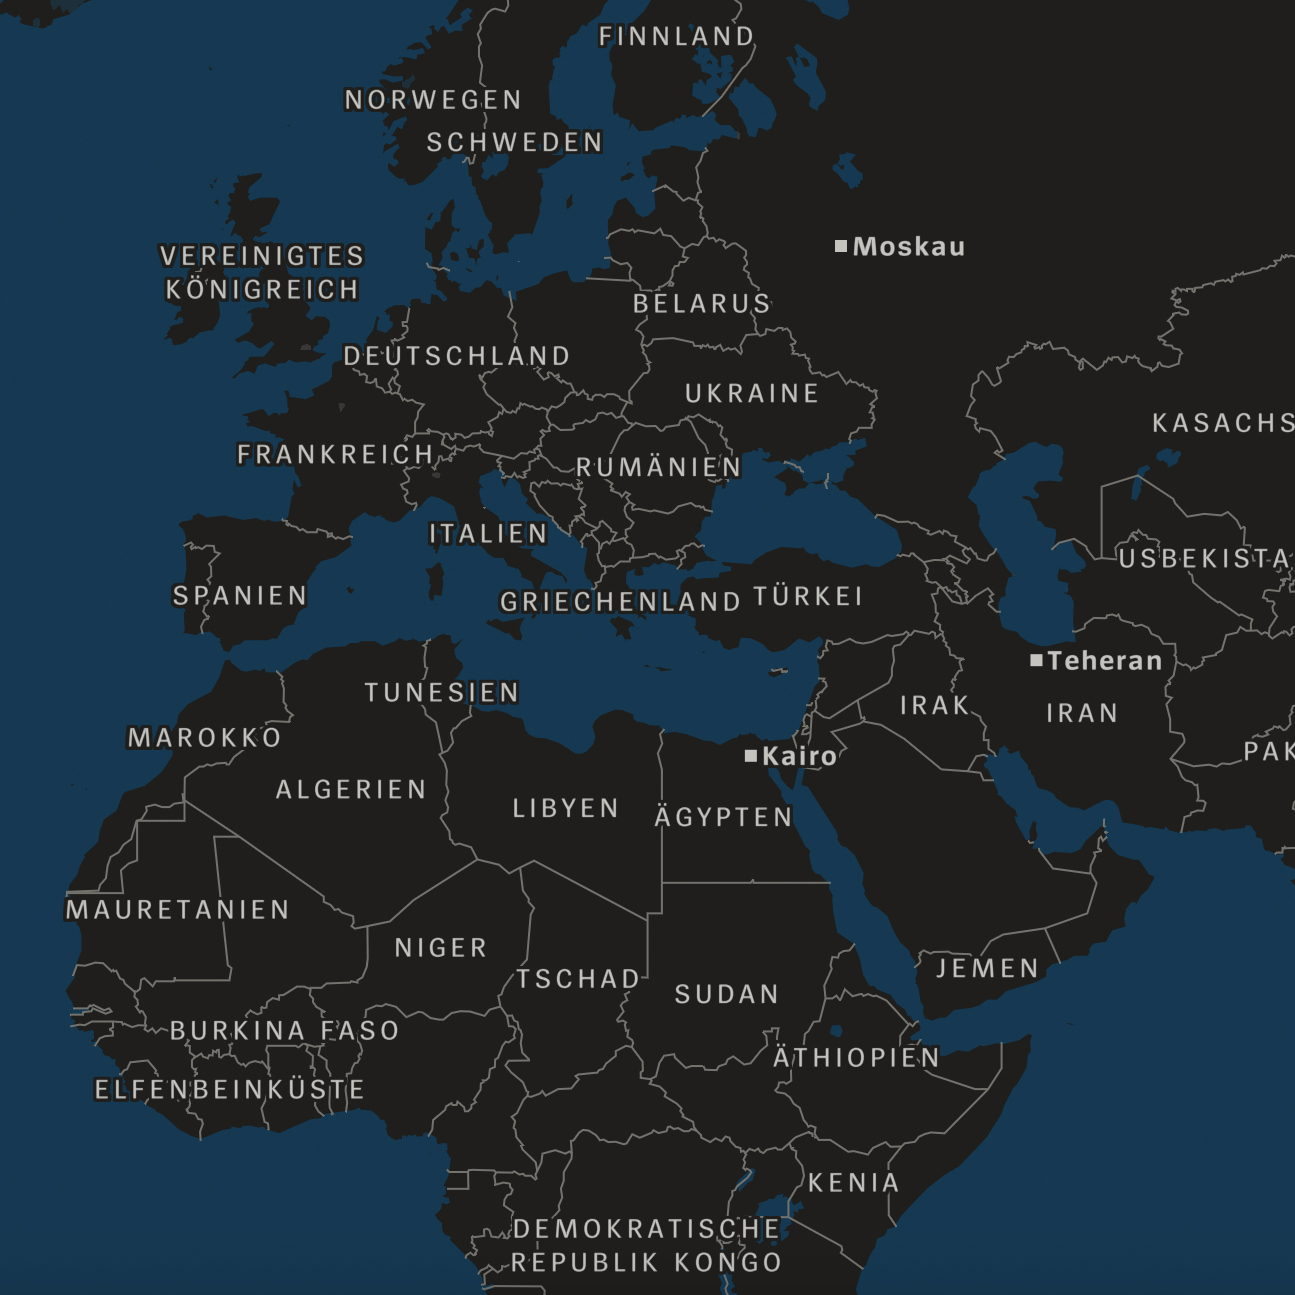
The proof of concept was to be demonstrated through a data-driven story about student living costs in German university cities. Readers can select a city via the search field on a large look-up map, as well as find additional options and a chart providing further context on the selected city on a small dashboard. Depending on the device settings, the map offers light and dark mode style variants. I built the frontend using JavaScript and Svelte, including a »SPIEGEL«-tailored, reactive MapLibre GL Svelte wrapper with specific components, looks and functions.
After some tweaking on the caching ruleset, the proof of concept worked well: Our CDN caches HTTP range requests to the PMTiles container in the same way as normal requests and at the same cost as an HTTP request for any flat file. Therefore, our setup proved effective and efficient, even in high-load scenarios.
Mapping complex data
We often need to plot complex datasets containing hundreds of thousands of data points. This data can be easily simplified and tiled in a PMTiles container using tippecanoe. The container can then be added to the map either programmatically or by adding it to the map style via Maputnik’s graphical interface, thus eliminating the need to write any code. You can also package raster data to a PMTiles archive (e.g. using Python via a rasterio plugin) and add it to your map similarly.
See it live
- Study in Germany: how much does it cost? – published at »DER SPIEGEL« on July 7, 2025
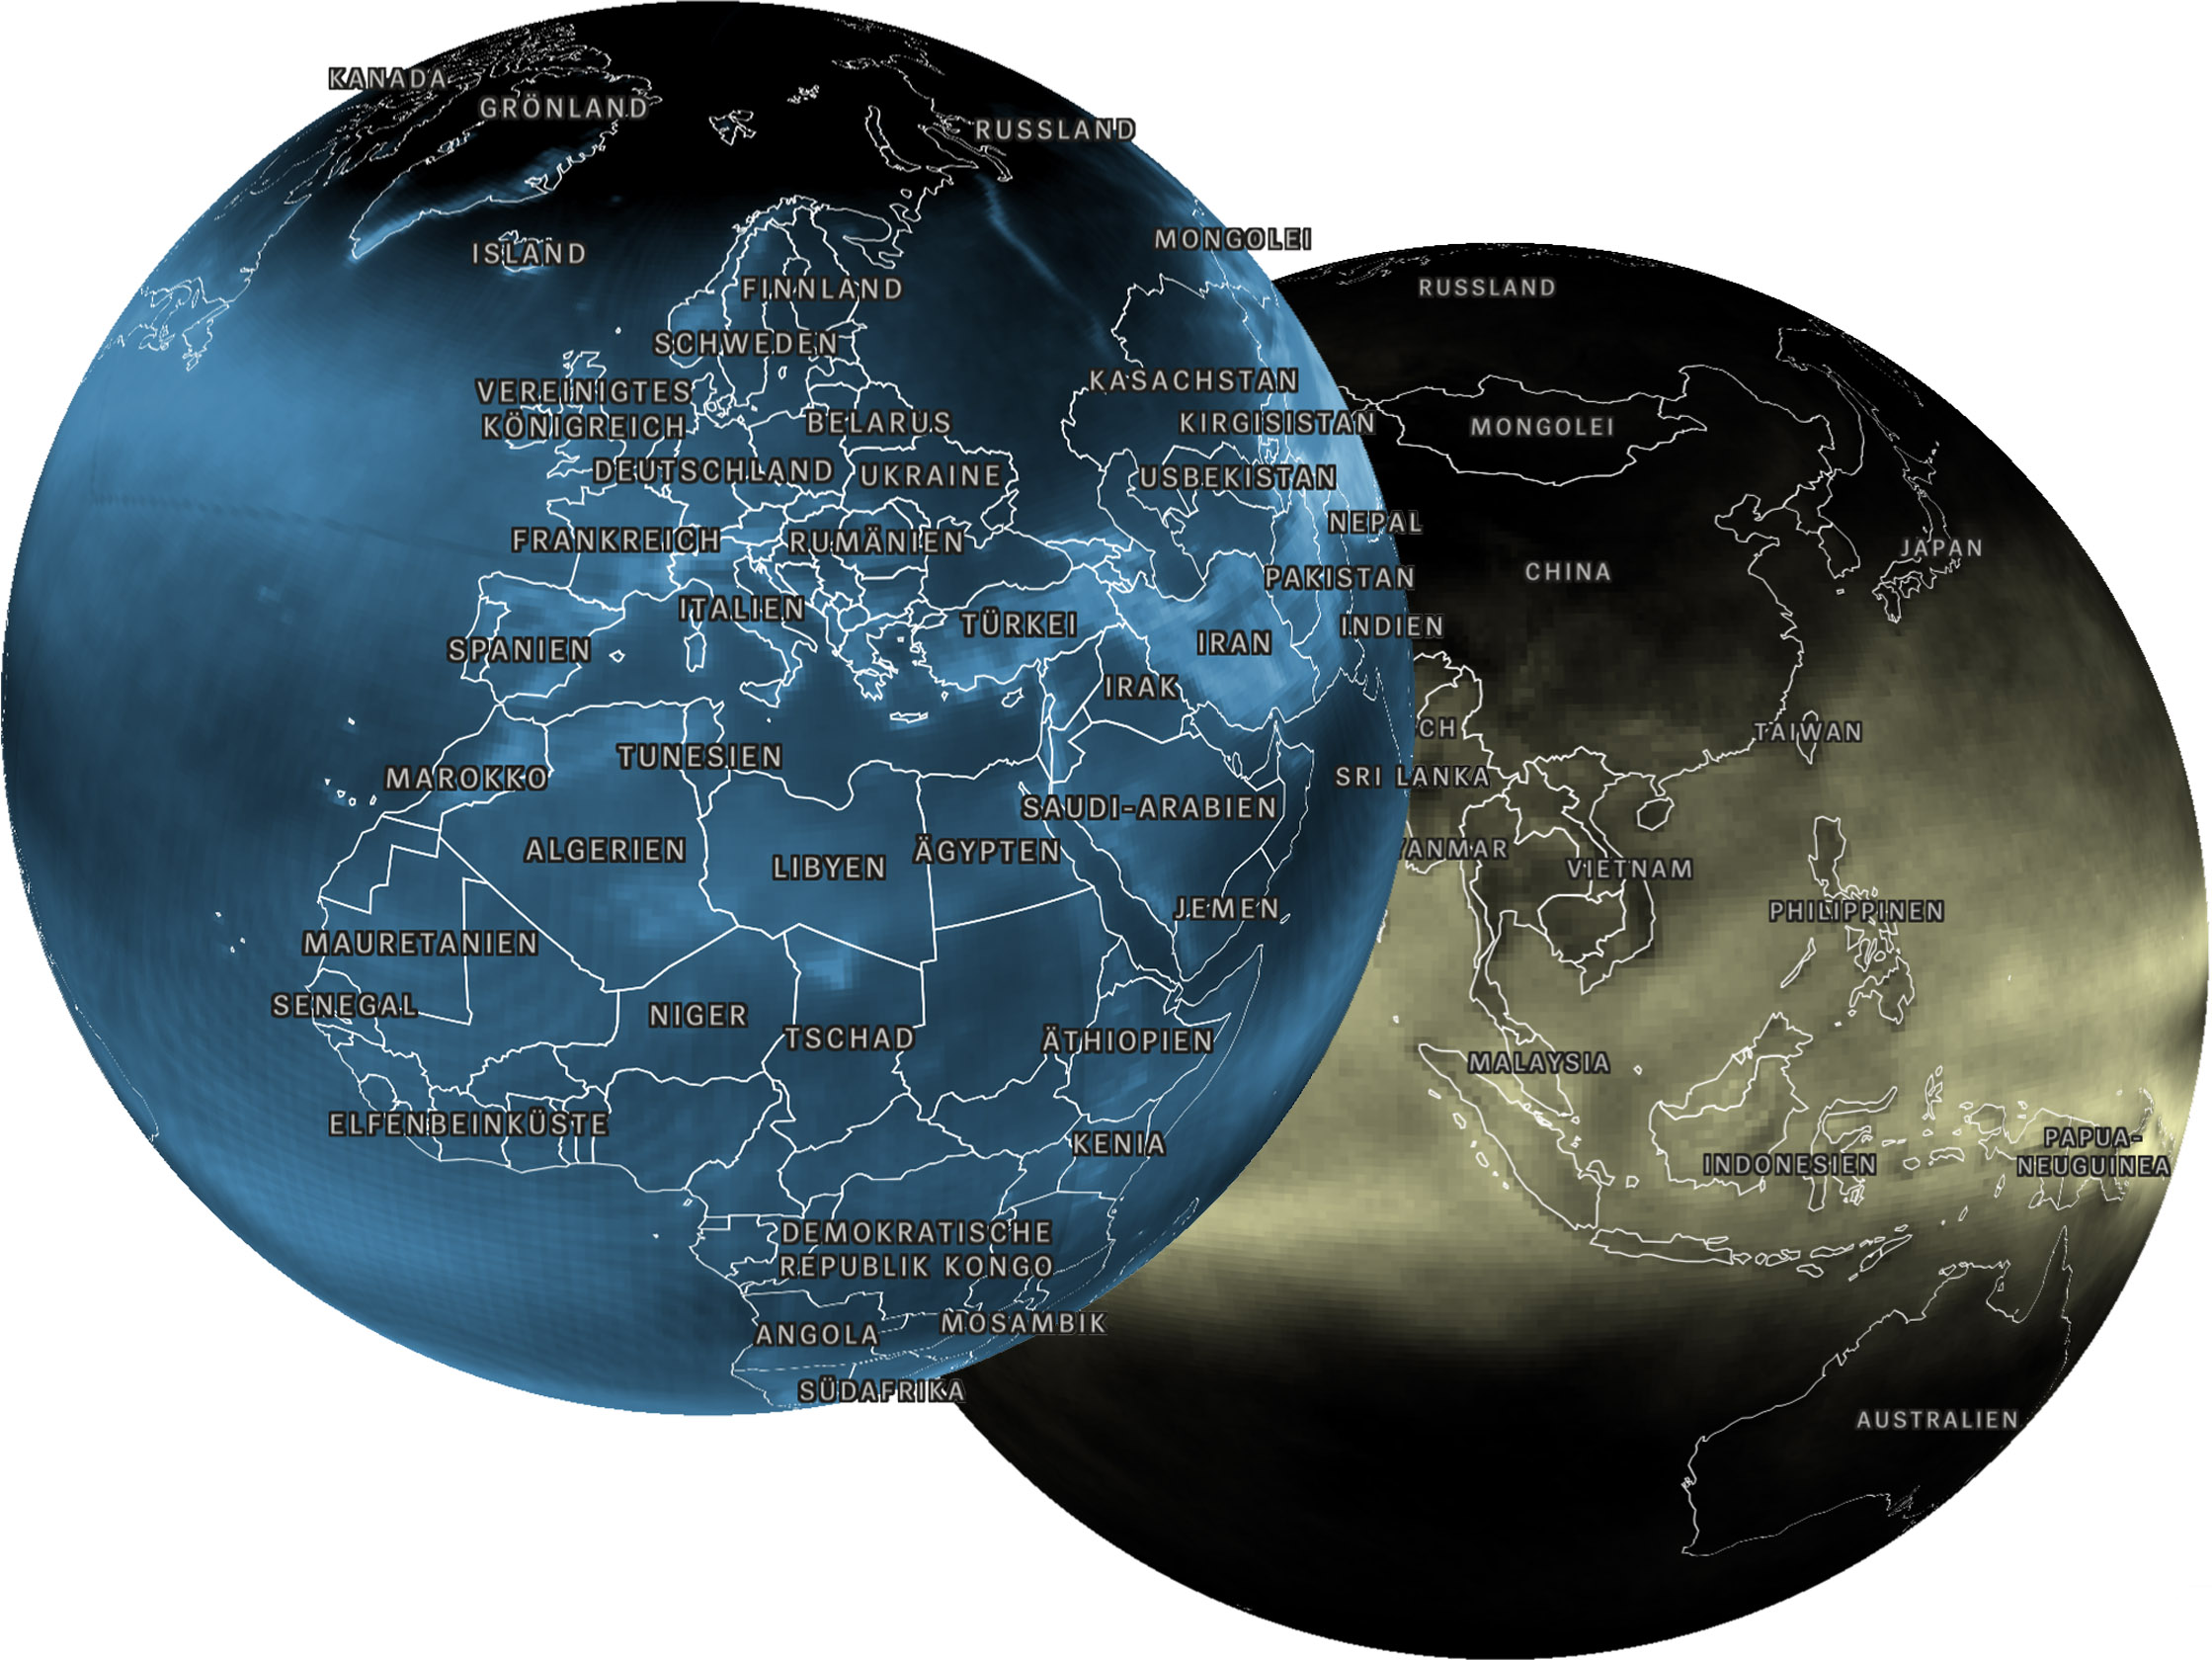
- Where turbulence occurs most frequently and how to protect yourself. – published at »DER SPIEGEL« on August 17, 2025
Talk
- Independent of Mapbox and Co – with self-hosted interactive maps – talk at NIAM 2026, the annual Conference of the German Cartographic Society (in German)